VICTORIA GEDDES, Executive Director
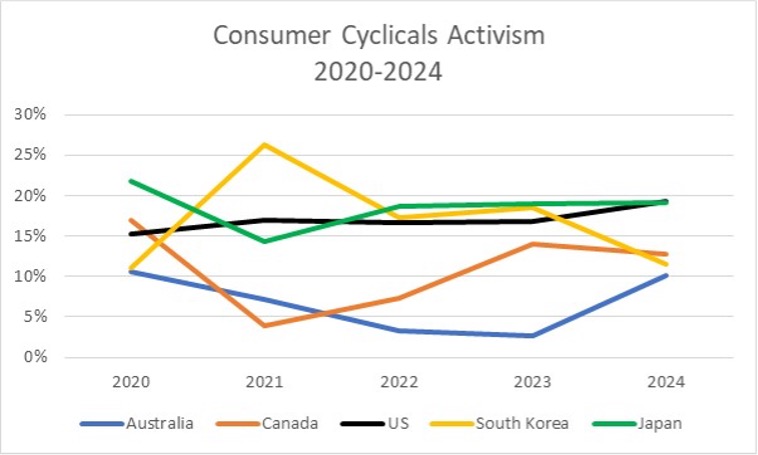
Up until 2022, Canada and Australia regularly traded places to claim the mantle as the country, second only to the US, with the most activist campaigns. However, post Covid, Asia discovered activism with Japan in particular rocketing ahead, followed closely by South Korea.
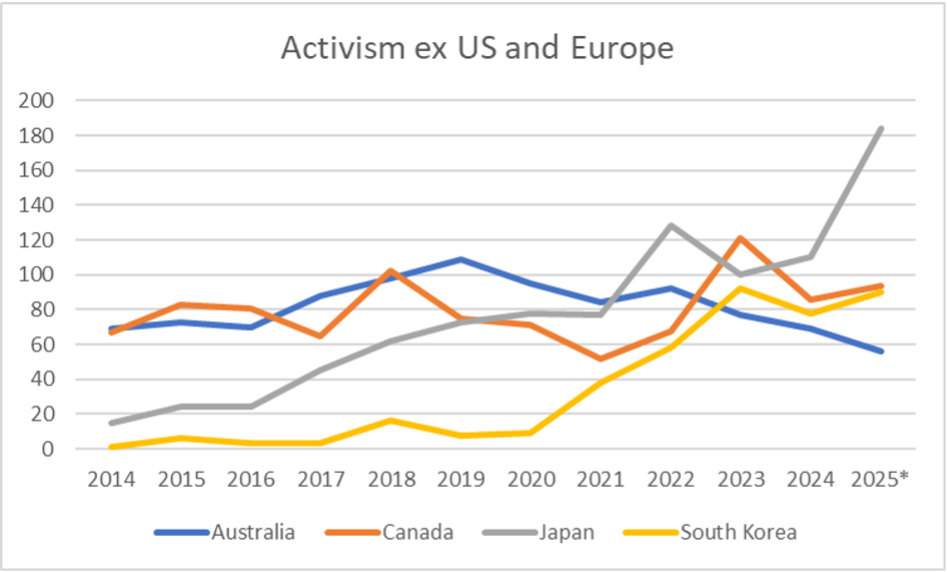
* Note that numbers for the first six months of 2025 have been annualised to provide a sense of the general trend which, for Australia, is a continued decline while Japan is rapidly accelerating.
Source: Diligent and FIRST Advisers
The US is the powerhouse of domestic and global activism with the annual number of campaigns over the decade to 2024 averaging 850. The whole of Europe comes a distant second with c. 230 campaigns per annum.
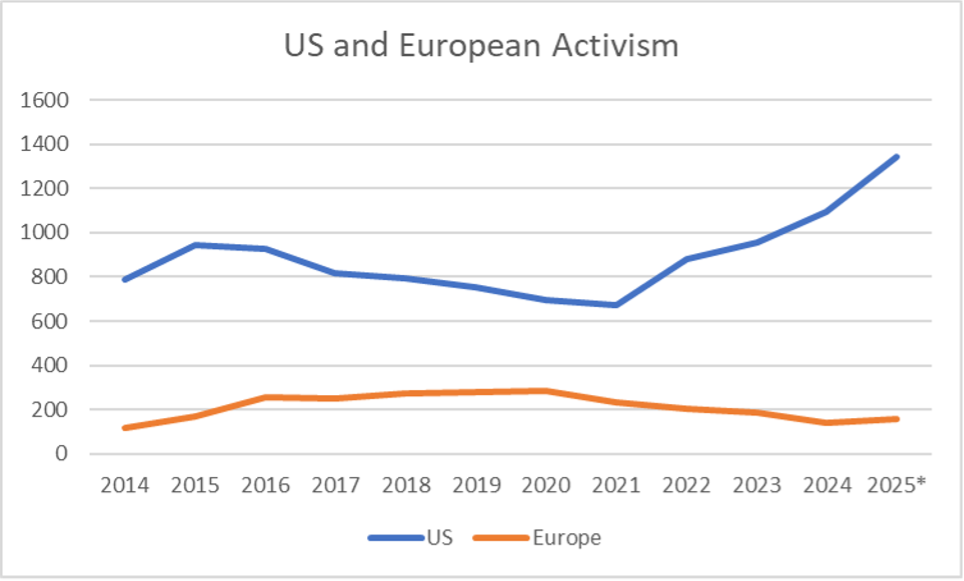
Source: Diligent and FIRST Advisers
The appetite for activism in Europe has been in decline since 2020 (287 campaigns) with the number of campaigns halving to 142 by 2024 with little if any growth expected this year. By contrast, after six years of decline from 2015 to 2021, activism in the US has been on a tear. Over the past 3 years activity increased 63% and has continued to grow strongly in 2025.
There are other regions in the world where activism takes place but it is very much at the margin and there is no particular sign of an emerging trend. Since 2014 the average annual number of campaigns for the Middle East (7.7), Africa (6.8) and Central America/Caribbean (6.3) reflected a level of activity that could range from 0 to 20 in any one year. In South America (3.4) the typical experience would be more like 1-4 campaigns per year.
Australia’s bias to Activism in Nanocaps
In Australia the most defining characteristic of activism compared to anywhere else in the world is its concentration amongst nanocap stocks as the following chart highlights so graphically. An average of 52% of all campaigns over the past decade have played out in companies with a market cap of less than $50m. If we include microcap companies that number jumps to just under 70%.
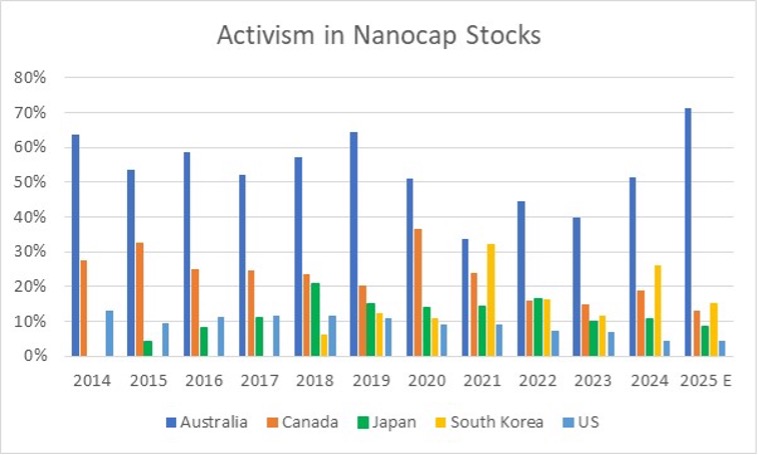
Source: Diligent and FIRST Advisers
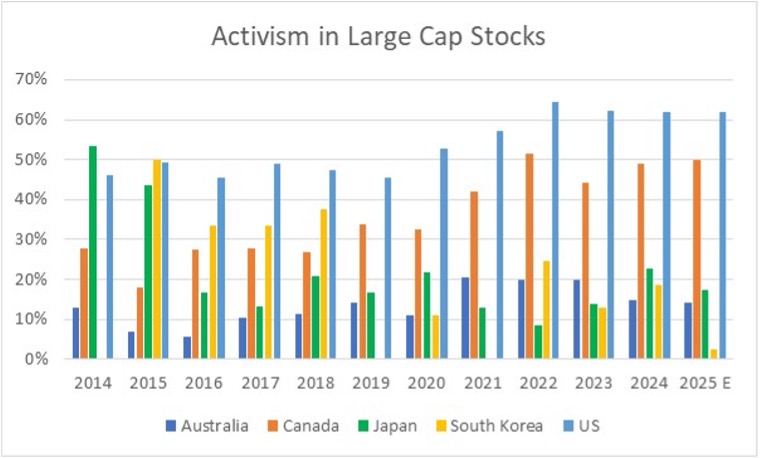
By contrast, since 2021, the majority of activist proxy battles in the US (+60%) and Canada (+45%) have been waged with large cap companies (≥$10bn). Like Australia, however, Canada has a strong exposure to small mining and exploration companies, which has also fueled a healthy level of activism (albeit declining) in the nanocap segment (19%) of the market.
In the rapidly growing Asian markets of Japan and South Korea the picture looks different again. Activism in Japan is well diversified across companies of all sizes with a slight bias to small caps over the past decade (33%). In South Korea 72% of activism since 2016 has focused on companies with a market cap of less than US$2bn ie small, micro and nanocap stocks, a trend which has accelerated since 2021 with the average increasing to 78% due to greater activity amongst the nanocaps.
The Sectors most favoured by Activists
Source: Diligent and FIRST Advisers
The two other sectors that rank in the top 3 for the US, South Korea and Japan are Industrials and Technology.
| 10 Year Average Ranking of Activism by Sector | US | South Korea | Japan | Canada | Australia |
|---|---|---|---|---|---|
| INDUSTRIALS | 3 | 3 | 1 | 4 | 6 |
| Percent of Total | 13% | 17% | 29% | 9% | 7% |
| TECHNOLOGY | 2 | 1 | 3 | 5 | 4 |
| Percent of Total | 14% | 20% | 12% | 9% | 7% |
In Australia and Canada, the Basic Materials and Financial Services sectors both sit in the top 3. They stand out as the only countries where these sectors are actively targeted and account for 40-47% of all activism with Basic Materials in Australia dominating all other sectors.
| Company HQ and Sector | 2015 | 2016 | 2017 | 2018 | 2019 | 2020 | 2021 | 2022 | 2023 | 2024 | 10 Year Average | Percent of Total |
|---|---|---|---|---|---|---|---|---|---|---|---|---|
| AUSTRALIA | 73 | 70 | 88 | 98 | 109 | 95 | 84 | 92 | 77 | 69 | 85.5 | |
| Basic Materials | 38 | 23 | 28 | 32 | 39 | 30 | 34 | 34 | 31 | 23 | 31.2 | 36% |
| Energy | 11 | 15 | 16 | 14 | 4 | 11 | 9 | 9 | 9 | 11 | 10.9 | 13% |
| Financial Services | 10 | 6 | 3 | 8 | 16 | 12 | 13 | 13 | 11 | 6 | 9.8 | 11% |
| CANADA | 83 | 81 | 65 | 102 | 75 | 71 | 52 | 68 | 121 | 86 | 80.4 | |
| Basic Materials | 20 | 20 | 16 | 27 | 19 | 17 | 14 | 10 | 12 | 9 | 16.4 | 20% |
| Financial Services | 11 | 10 | 12 | 17 | 13 | 15 | 12 | 18 | 27 | 24 | 15.9 | 20% |
| Consumer Cyclical | 3 | 11 | 5 | 6 | 10 | 12 | 2 | 5 | 17 | 11 | 8.2 | 10% |