VICTORIA GEDDES, Executive Director
Activism in Australia is highly concentrated by sector, market cap and demand type. It is focused on the basic materials sector, in nano cap stocks and with two-thirds of demands being for changes to the board. This is highly unusual in a global context where activity is more evenly spread across sectors and market cap. In this blog we look at the shape of Australian activism and recent trends that are emerging.
Sector Concentration
The sector where activism dominates in Australia is, and always has been, the Basic Materials sector with 30-40% of campaigns over the past decade focused on these companies. In that time the Energy sector (2014-2018) and Financial Services (2019-2023) have challenged for second place, with the peak years of activism from 2018-2020 seeing unusual levels of activity in the Technology, Consumer Cyclicals and Industrials sectors.
Australian Activism by Sector
2014 2015 2016 2017 2018 2019 2020 2021 2022 2023 2024 2025
YTD
AUSTRALIA 69 73 70 88 98 109 95 84 92 77 69 28
Basic Materials 30 38 23 28 32 39 30 34 34 31 23 12
Energy 11 11 15 16 14 4 11 9 9 9 11 3
Financial Services 6 10 6 3 8 16 12 13 13 11 6 2
Consumer Cyclical 4 3 5 6 6 13 10 6 3 2 7 4
Industrials 7 3 2 6 8 7 10 4 7 9 2 2
Technology 6 1 6 8 11 6 10 7 4 4 6 0
Source: Diligent
What is interesting however is that while the total number of campaigns in 2024 has fallen back to the same as 2014, the Basic Materials sector now accounts for 33% instead of 43% and all sectors are experiencing some level of activism. The three sectors that have filled the space, going from inactive to 2-4 campaigns during the year, are Communication Services, Funds and Healthcare.
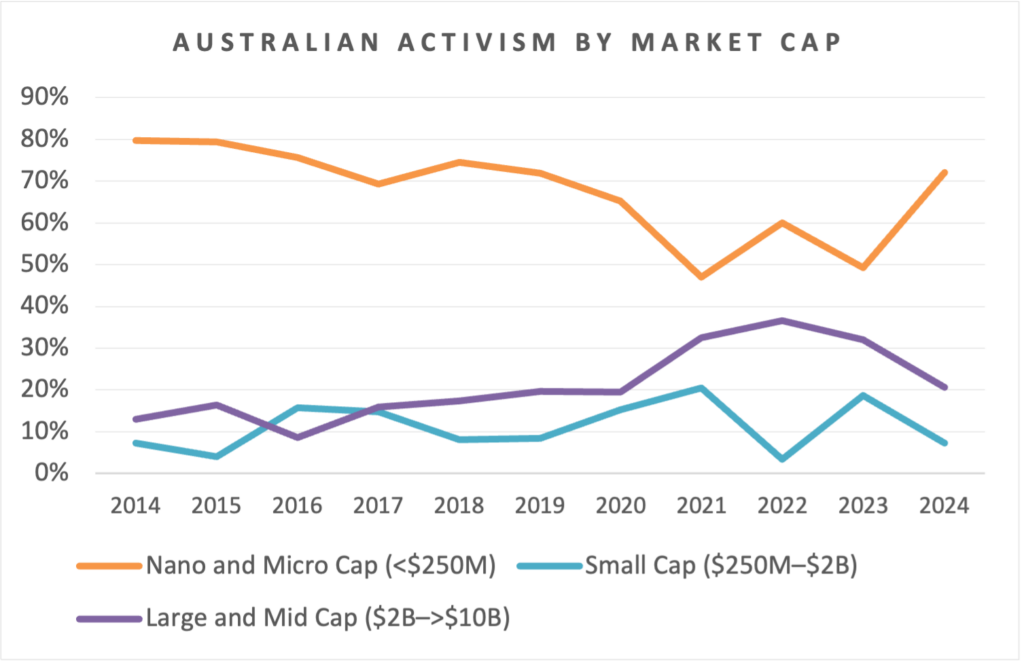
Australian Activism by Market Capitalisation
Up until 2019, 70-80% of activism occurred in microcap and nanocap stocks in the basic materials and energy sectors. As we discussed in our July 2024 article, activism generally has been in decline since 2019, falling 30% over five years.
Source: Diligent and FIRST Advisers
Today the microcap and nanocap segments of the market still attract the majority of activism. While this trend fell during 2020-2023 to 45-60%, activity levels in 2024 returned to within their long-term average at 72% of total activism and we expect a similar result this year.
Mid-cap and Large-cap stocks now account for 21% of total activism, a level not seen since 2019-2020, and well below the 34% average of the previous three years. Based on current trends this is likely to fall further this year.
Small caps (defined as $250M to $2B market cap) have historically not been targeted by activists in Australia. Apart from recent bursts of activity in 2020, 2021 and 2023, this group of companies would account for less than 7% of activism since 2018.
Activist Outcomes being Targeted
Source: Diligent and FIRST Advisers
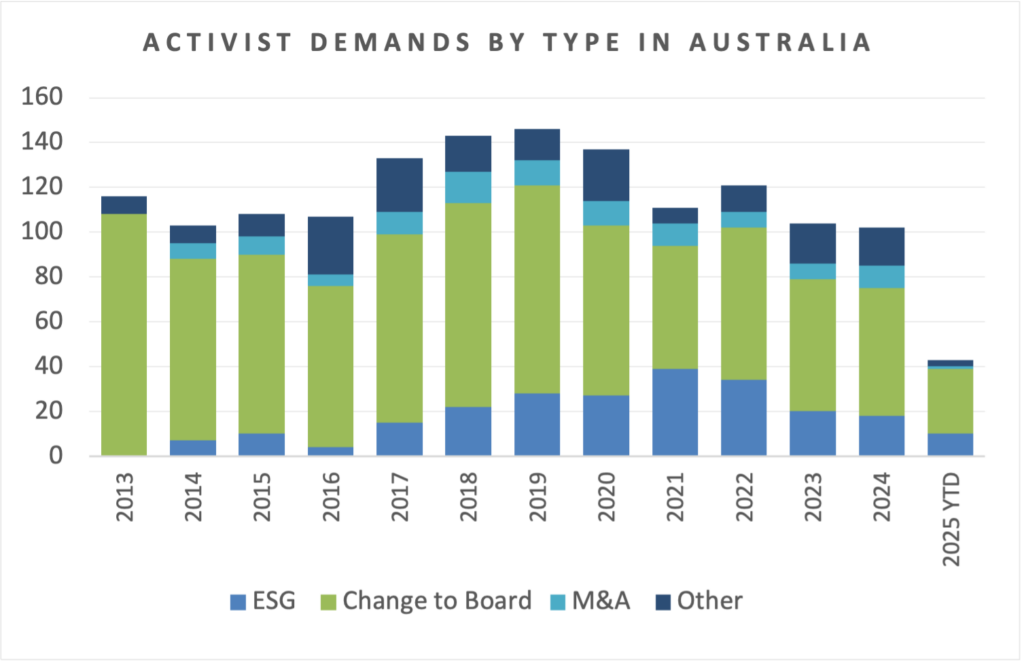
In Australia, seeking changes in personnel either through adding people to the board or removing board members/the CEO (or both) is the main game in town. Twelve years ago this represented 93% of activism, but in the last 5 years has fallen to an average of 57% and is largely responsible for the overall decline in activism during that time.
In its place ESG activism has filled the gap, an area inhabited by the large and mid-cap stocks as discussed in our July 2025 newsletter. Aside from two boom years in 2021 and 2022, ESG activism has averaged around 17% of total activism since 2018. The third largest category, M&A, has consistently averaged 8% of total activism over the past decade.

